Global Economic Outlook 2026: Gold, Stocks, and GDP
The 2026 Economic Landscape: A Comprehensive Analysis
The global economy in 2026 stands at a critical crossroads, shaped by fluctuating commodity prices, volatile equity 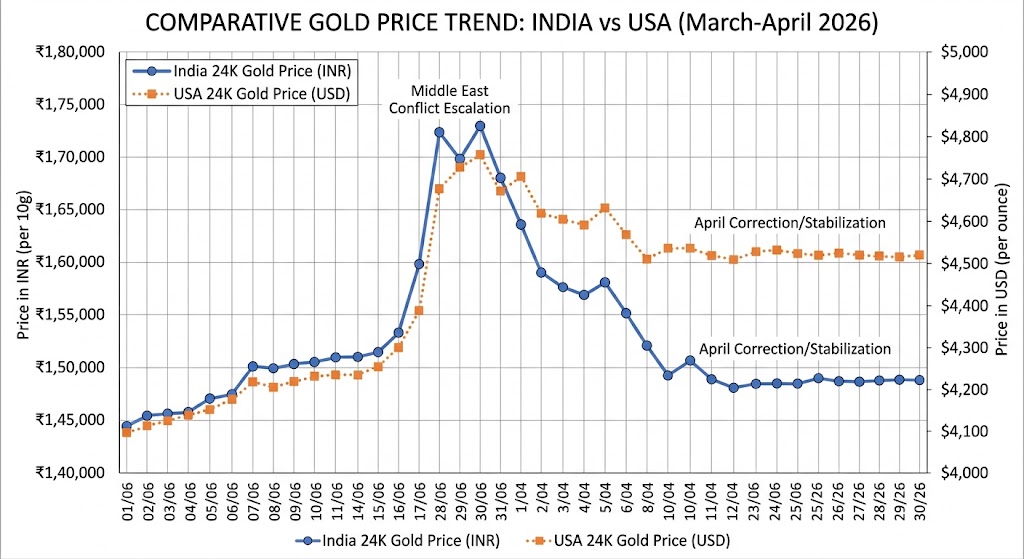 markets, and a geopolitical climate defined by the lingering effects of the US-Israel-Iran conflict. As investors navigate this complex terrain, understanding the comparative dynamics between the world’s largest economy, the United States, and the world’s fastest-growing major economy, India, is essential. This article provides a deep dive into gold trends, stock market performance, and the broader economic implications of current global events.
This line chart tracks the fluctuating prices of 24K gold in India (INR/10g) and the USA (USD/oz) during March and April 2026. It highlights the direct impact of the Middle East conflict escalation, showing the peak in mid-March followed by stabilization in April. The visualization clearly demonstrates how global geopolitical tension drives investor demand for safe-haven assets across both major markets.
Gold Price Analysis: March to April 2026
Gold has traditionally served as a safe-haven asset during times of global uncertainty. In the spring of 2026, the precious metal has lived up to this reputation, though not without significant volatility.
Recent Trends in India and the USA
During March 2026, gold prices witnessed a dramatic roller-coaster ride. In early March, prices peaked at record highs, with 24K gold in India touching approximately ₹1,69,000 per 10 grams. This surge was primarily driven by the escalation of tensions in West Asia, which sent investors scurrying toward "safe" assets as a hedge against currency devaluation and geopolitical risk.
However, as April 2026 commenced, a slight technical correction took place. By early April, gold stabilized at approximately $4,522 per ounce in the international market. In the Indian domestic market, while prices remained elevated compared to previous years, they settled into a consolidation phase around ₹1,59,000 to ₹1,65,000 per 10 grams depending on the city and local taxes.
Comparative Gold Values
While the base price of gold is determined globally, domestic prices in India and the US differ due to currency fluctuations and import duties.
USA: Prices are quoted in USD per ounce. In 2026, the US market saw a steady rise in retail investment in gold coins and bars as a response to persistent inflation, which hovered around 3.2%.
India: Prices are heavily influenced by the USD-INR exchange rate. Since India imports nearly 90% of its gold, a weaker rupee—trading near ₹93 in April 2026—automatically inflates the local price of the metal.
The disparity is often attributed to the strength of the US Dollar and local demand-supply dynamics within the Indian jewelry sector, especially during the wedding season which coincided with the March-April period.
Stock Market Performance: Sensex vs. US Indices
The equity markets in 2026 have been a tale of two halves, responding aggressively to every headline regarding de-escalation or flare-ups in global conflicts.
India’s Sensex: Resilience Amidst Volatility
The Indian benchmark index, the BSE Sensex, started the 2027 fiscal year (April 1, 2026) with high volatility. While early April saw some relief rallies, the index has faced pressure, shedding points on days when crude oil prices spiked. By April 6, 2026, the Sensex showed signs of caution, trading near the 73,000 mark. Investors are particularly wary of the "triple deficit" threat—fiscal, current account, and energy deficits—which makes the Indian market sensitive to foreign fund outflows.
US Market Outlook (Dow Jones & S&P 500)
The US stock market has faced different structural pressures. The Dow Jones and S&P 500 have been influenced by the Federal Reserve's "higher for longer" interest rate stance. With rates maintained in the 3.5%–3.75% range to combat a 3.2% inflation rate, US equities have seen more subdued growth compared to the aggressive bull runs of previous years. However, the US tech sector continues to provide a floor for the market, driven by advancements in artificial intelligence and defense technology.
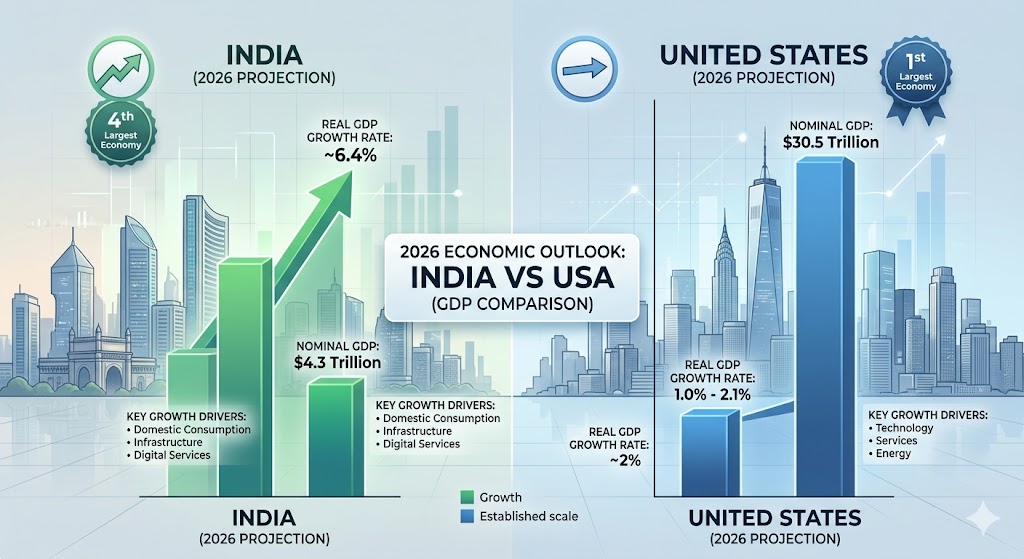
Global Economic Rise: GDP Comparison 2026
The most significant metric in the India vs. USA comparison is the rate of economic expansion. 2026 highlights a widening growth divide between emerging and advanced economies.
• The Numbers: A Side-by-Side View
The following table illustrates the current economic standing of both nations as of mid-2026.
| Economic Indicator | United States (2026) | India (2026)
| Nominal GDP | $30.5 Trillion | $4.3 Trillion |
| Real GDP Growth Rate | 2.1% | 6.2% - 6.4% |
| GDP Per Capita | $89,105 | $2,934 |
| Global Ranking | 1st | 4th |
| Primary Growth Drivers | Technology, Services, Energy | Domestic Consumption, Infrastructure, Digital Services |
Analyzing the Gap
While the United States remains the undisputed leader in total economic output, its growth is that of a "mature" economy. A 2.1% growth rate for a $30 trillion economy is substantial in absolute terms but represents a slowing momentum.
In contrast, India’s 6.4% growth rate makes it the fastest-growing major economy in the world. India has successfully overtaken several European counterparts and is currently breathing down the neck of Japan for the #3 spot. However, the "per capita" gap remains the biggest challenge for India; while the total "pie" is growing, the average income per person in the US is still nearly 30 times higher than in India.
The US-Israel Conflict: Strategic Disadvantages for India
The geopolitical friction involving the US, Israel, and Iran since February 2026 has created significant "headwinds" for India's developmental goals.
1. Energy Security and the Strait of Hormuz
India's Achilles' heel is its dependence on imported energy. Approximately 88% of India's oil and 65% of its cooking gas (LPG) are imported, with a massive portion passing through the Strait of Hormuz. The 2026 conflict has led to:
Fuel Spikes: Petrol and diesel prices in India have surged, impacting transportation costs for all essential goods.
LPG Shortages: Commercial sectors, particularly the hospitality industry in cities like Mumbai and Chennai, have faced severe gas rationing, leading to closures.
2. Fertilizers and Food Inflation
The Middle East is a primary source of nitrogen-based fertilizers for India. The disruption in supply chains has raised cultivation costs for Indian farmers. If this persists, it poses a direct threat to India’s food security, potentially leading to higher prices for staples like rice and wheat by the end of 2026.
3. Trade and Logistics
Indian exports, particularly Basmati rice and tea, have seen their competitiveness erode. Increased shipping insurance premiums and the need to reroute vessels away from conflict zones have added 15% to 20% to the cost of Indian goods reaching Western markets.
The United States occupies a complex role in the 2026 global conflict. Unlike India, which is primarily a consumer of global stability, the US is both a producer of security and a participant in the conflict's economic Fallout
The "War Dividend" (Benefits)
Defense Industrial Base: US defense contractors (Lockheed Martin, Raytheon, etc.) have seen record order books as the US provides military aid to Israel and replenishes its own stockpiles.
Energy Independence: Because the US is now a net exporter of energy, high global oil prices do not hurt the American economy as much as they did in the 1970s. In fact, US shale producers benefit from higher global prices.
The Strategic Burden (Disadvantages)
Fiscal Strain: The US budget deficit is projected to remain at a staggering 7% of GDP in 2026. Funding foreign conflicts while managing a $34 trillion national debt limits the government's ability to invest in domestic social programs or infrastructure.
Diplomatic Overstretch: The US risks alienating emerging partners in the "Global South" (including parts of Southeast Asia and Africa) who view the focus on the Middle East as a distraction from global climate and development goals.
Sector-Specific Impact: Manufacturing and Services
India's Industrial Hurdles
The 2026 energy crisis has hit India's MSME (Micro, Small, and Medium Enterprises) sector hard. In manufacturing hubs like Gujarat, factories have faced gas allocation limits of 65%, leading to temporary shutdowns in energy-intensive industries like ceramics and textiles.
USA's Service Dominance
The US economy remains anchored by its services sector, which accounts for over 75% of its GDP. Even with global instability, American software-as-a-service (SaaS) and financial services have shown high resilience, as digital trade is less affected by physical maritime blockades than India’s physical commodity trade.
Conclusion: A Tale of Two Trajectories
As we progress through the second quarter of 2026, the economic divergence between India and the USA is clear. India is an emerging giant struggling with the growing pains of energy dependence and geopolitical vulnerability. The United States is a seasoned hegemon leveraging its military and energy might but facing the long-term fiscal consequences of global policing.
For India to reach its goal of a $5 trillion economy, it must navigate the "Strait of Hormuz" challenge by accelerating its transition to green hydrogen and solar energy. For the USA, the challenge is to maintain its 2.1% growth without letting the "Fog of War" inflate its national debt to unsustainable levels.